Data Manipulation and Visualisation using R
Intermediate R Course
View the Project on GitHub bioinformatics-core-shared-training/r-intermediate
Course Description
It has been said that 80% of data analysis is spent on the process of cleaning and preparing the data. In this course we introduce some relatively-new additions to the R programming language; dplyr and ggplot2. In combination these provide a powerful toolkit to make the process of manipulating and visualising data easy and intuitive.
Course Prequisites
We will assume that you have basic familarity with R and are familiar with vectors, data frames, variables and using functions. We have a crash course that covers these topics.
Several Online videos are available that cover these materials, for example
- http://shop.oreilly.com/product/0636920034834.do
- http://blog.revolutionanalytics.com/2012/12/coursera-videos.html
- http://bitesizebio.com/webinar/20600/beginners-introduction-to-r-statistical-software
Topics Covered
- How R enables reproducible research
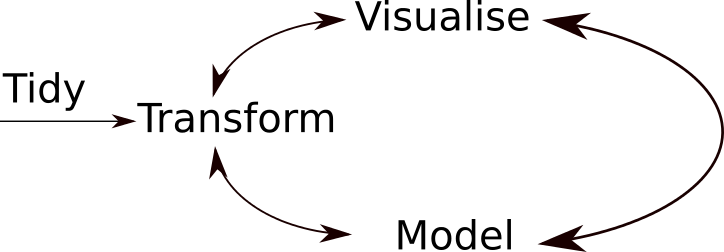
- What constitues a tidy dataset
- "Piping" commands together to form a workflow
- Subseting and filtering datasets using dplyr
- Producing summary statistics from a dataset
- Joining datasets using dplyr
- The grammar of graphics approach to plotting used in ggplot2
- Producing publication-ready graphics using ggplot2
Course Data
Please click on this link to download all the files required to run the examples in the course.
Software
You will need an updated version of R and RStudio Desktop.
Schedule
- Introduction
- Plotting data with ggplot2
- Tidying and transforming data
- Writing analysis workflows in R
- Summarising and Combining data